· Matthias Quinn · 4 min read
Power Analysis Calculator
This post is a walkthrough of various power analyses in R.
I’m often asked, as a part of my job, to figure out how many entities/people are needed to see a significant effect on some process or metric. These seemingly simple requests can have a profound effect on where business leaders decide to go with a project, if at all. Thus, the reasoning behind this calculator is to provide people with a no-code interface to some common statistical tests.
A couple of months ago (2022), I was asked to give a few presentations to my team and a couple of outside business folks on how to properly conduct a power analysis. I wasn’t the strongest at performing such tests, as I had no formal training on how to do one and was taught more theoretical aspects, but I went ahead and researched on my own. Along the way, I began to realize that - unless you know what you’re doing - it was very easy to be given some sample numbers and given an output. Unfortunately, the validity of the inputs was not always bulletproof. Sometimes, the requester wasn’t quite sure of the numbers he/she was presenting, so it would lead to some discussions around his/her purposes.
Advice
Power analyses are easy to conduct, but can be difficult to prove.
The most difficult part of the project was figuring out the UI, as I was inspired by G*Power’s user interface, but I didn’t necessarily want a straight copy. So, I settled for a seemingly simple approach.
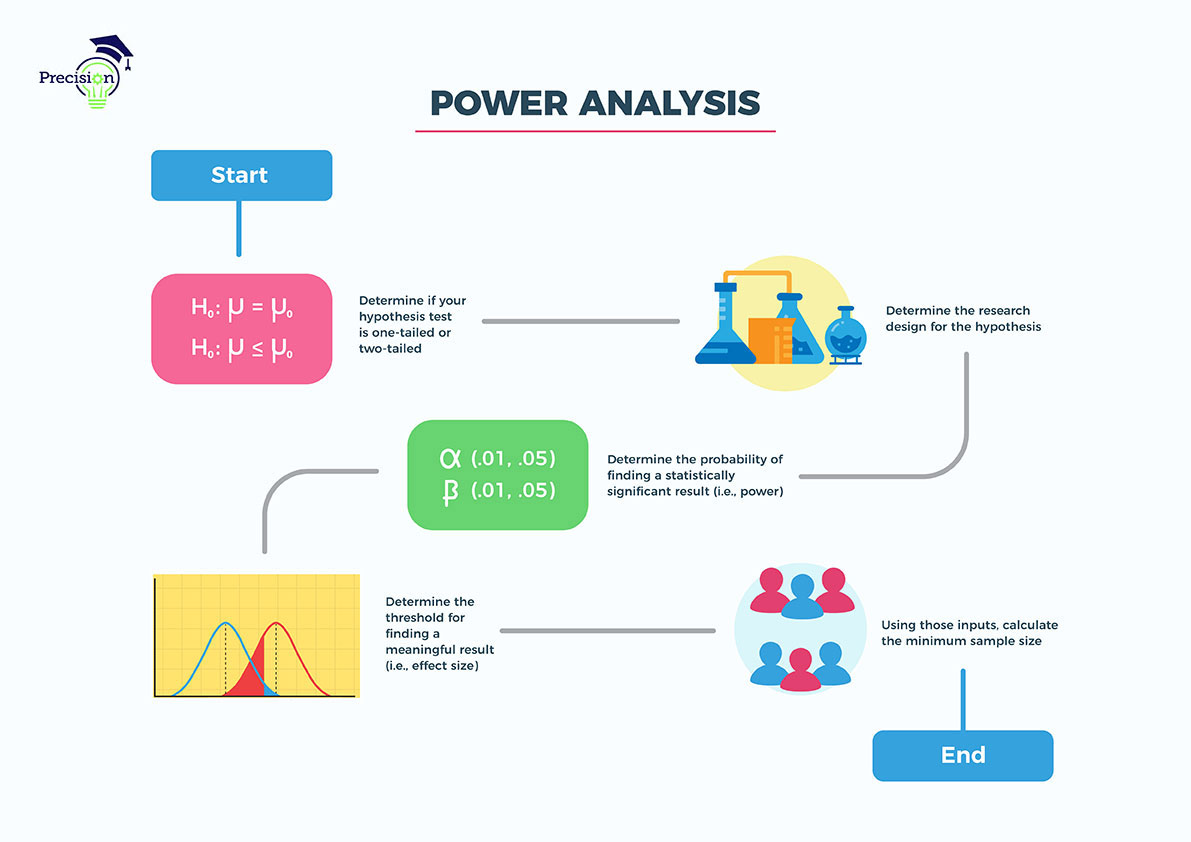
- Figure out your research question
- Figure out what type of test you want to / need to conduct
- Gather your assumptions and inputs
- Choose and enter the requirements
- Receive results
Honestly, the most difficult steps are and , as mentioned earlier. Thus, it’s imperative that a user understands what he/she is doing before receiving the results. As an example, a request was made to me to figure out how many days an A/B test would have to run to provide statistically significant results. I performed a power analysis and came back with my estimate on how long it would take to achieve a provable result.
As it turns out, upon further questioning, the requester told me that the test was only going to run for a maximum of days. There wasn’t any way for results to be statistically verifiable. Instead of lying to her, I was upfront and told her that she wasn’t going to get what she wanted in just days, which paid off for me in the end. She understood what I said after just a little more convincing, and the sandbox went off without any problems.
Purpose of Power Analysis
When designing experiments, a key question to keep in mind is:
How many animals/subjects do I need for my experiment?
To small of a sample size can under detect the effect of interest; too large of a sample size, and you be lead to wasting unnecessary resources.
Effect size
: The magnitude of the effect under the alternative hypothesis
The larger the effect, the easier it is to detect and thus requires fewer samples
Power
: The probability of correctly rejecting the null hypothesis if it is false
Power is equal to where is the probability of a Type II error (FN)
Higher power allows for a better chance of detecting a true effect, if it exists
A standard power is equal to
Significance level ()
: The probability of falsely rejecting the null hypothesis even though it is true
The lower the significance level, the more likely you are to avoid a false positive and the more samples are needed
A standard significance level is equal to
Effect Sizes
The effect size in a power analysis is dependent on the sample data at hand.
How to estimate the effect size (Options)
- Use background information to get means and variation, then calculate the effect size directly
- Use background information from similar studies to get means and variation, then calculate the effect size directly
- With no prior information, make an estimated guess on the effect size expected
Table of Tests and Functions
| ID | Name of Test | In R? | Package | Function |
|---|---|---|---|---|
| 1 | One Mean t-test | Yes | pwr | pwr.t.test |
| 2 | Two Means t-test | Yes | pwr | pwr.t.test |
| 3 | Paired t-test | Yes | pwr | pwr.t.test |
| 4 | One-way ANOVA | Yes | pwr | pwr.anova.test |
| 5 | Single proportion test | Yes | pwr | pwr.p.test |
| 6 | Two proportions test | Yes | pwr | pwr.2p.test |
| 7 | Chi-squared test | Yes | pwr | pwr.chisq.test |
| 8 | Simple Linear Regression | Yes | pwr | pwr.f2.test |
| 9 | Multiple Linear Regression | Yes | pwr | pwr.f2.test |
| 10 | Correlation | Yes | pwr | pwr.r.test |
| 11 | One Mean Wilcoxon Test | Yes* | pwr | pwr.t.test + 15% |
| 12 | Mann-Whitney Test | Yes* | pwr | pwr.t.test + 15% |
| 13 | Paired Wilcoxon Test | Yes* | pwr | pwr.t.test + 15% |
| 14 | Kruskal-Wallace Test | Yes* | pwr | pwr.anova.test + 15% |
| 15 | Repeated Measures ANOVA | Yes | WebPower | wp.rmanova |
| 16 | Multi-way ANOVA | Yes | WebPower | wp.kanova |
| 17 | Multi-way ANOVA | Yes | WebPower | wp.kanova |
| 18 | Logistic Regression | Yes | WebPower | wp.logistic |
| 19 | Poisson Regression | Yes | WebPower | wp.poisson |
| 20 | Multilevel Modelling: CRT | Yes | WebPower | wp.crt2arm |
| 21 | Multilevel Modelling: MRT | Yes | WebPower | wp.mrt2arm |
| 22 | GLMM | Yes** | Simr & lme4 |
Table of Statistical Tests and R Functions